E-Mini S&P 500 Futures
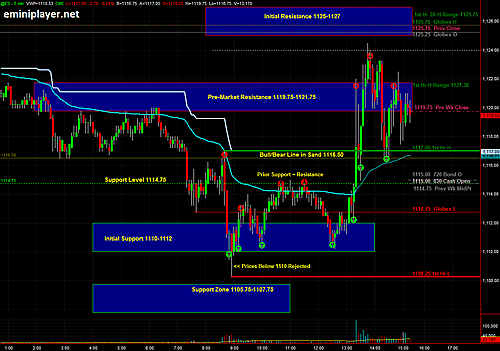
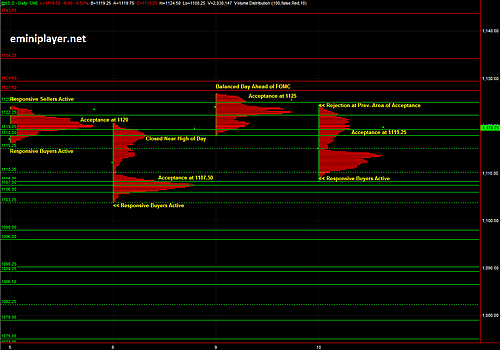
1116.50 was the Bull/Bear Line in Sand and the move up to 1117 provided a Short entry against the VWAP and 1116.50 Line in Sand with targets at 1110-1112 Initial Support. The push down to 1108.25 was on a positive NYSE TICK Divergence. Once prices below 1110 were rejected, the Level provided good trade location on the Long side with targets at the 1112.75 Overnight Low, followed by 1114.75 (prior support = resistance). The push up to 1115 was made on a negative NYSE TICK Divergence, and Shorts could have been initiated on that pop or the following test of 1114.75. Choppy, range-bound price action is typical ahead of the FOMC announcement, and NYSE TICK Divergences work very well in a range-bound enivonment. The following push down to 1110.25 was again on a positive NYSE TICK Divergence, and provided a signal to exit Shorts and/or initiate Longs. 1110-1111 provided good trade location and depending on your risk tolerance, the position could have been held into FOMC with a stop-loss at +2-3 ticks to account for slippage in case of a strong sell-off. ES is so liquid that even during periods of high volatility, stops typically get filled with only 1-2 ticks of slippage. 1119.75-1121.75 Resistance Area paused the initial Buying on the FOMC announcement, and price pulled back to the Bull/Bear Line in Sand at 1116.50. The following pullback to 1115 provided an opportunity to re-enter Long ahead of the 1114.75 support level. Even though ES closed above the IB High, and built Acceptance at 1119.25, Buyers were unable to test the 1125-1127 Resistance Area, which is a sign of weakness.
Notes for Overnight Session
The Key Levels from the morning are still in-play. We have Resistance at 1114.75-1115.25, followed by 1118-1120. The current context is range-bound. On the downside, a break below 1103.75 is a big red flag for Buyers. A break below the 1089-1091 Support Zone would shift control to the Sellers. On the upside, a break above the 1119-1121 Area would confirm Buyers in control. We're still at an inflection point.
ES 5-Minute Chart

ES Day Session Volume Profile Chart
