E-Mini S&P 500 Futures
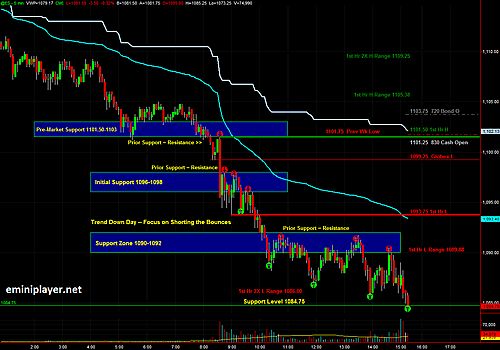
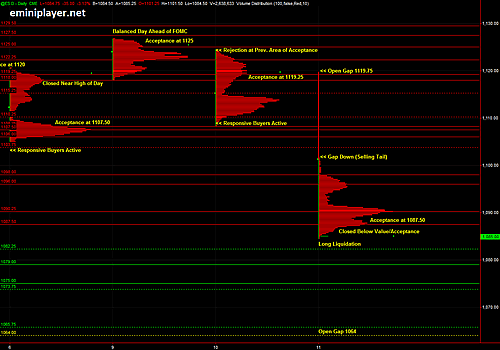
We finally got the Vertical Development I was looking for -- too bad half of it occurred in the overnight session. The "b"-shaped profile is indicative of Long Liquidation. On Long Liquidation / Trend Down days, price typically closes at or near the Low of Day. The Trade Plan provided 1096-1098 as a Target on a break of 1101.50. Prior Support = Resistance, and the 1101.50 area provided great trade location to initiate Shorts at the Cash Open. ES broke below 1096, and prior Support became Resistance and provided good trade location to re-initiate or add to Shorts with the next target in the 1090-1092 Area. Once price broke below 1090, that Area also became Resistance and provided good trade location to re-initiate or add to Shorts. On a Trend Down day, my focus is simply to Short every bounce until it stops working. Once a Support Area was broken and became Resistance; price never broke above it.
Notes for Overnight Session
After today's sell-off, prior areas of Support will act as Resistance on any moves back up. The 1079-1081 Area was marked as Strong Support, which is exactly why ES quickly sold off down to the next Support Area (1073-1074.25) once we broke below it in the overnight session. The Bull/Bear Line in Sand is at 1092, and the plan is to focus on the Sell side as long as price remains below that level. We have Resistance at 1083, 1085.50-1087.50 and 1090-1092.
ES 5-Minute Chart

ES Day Session Volume Profile Chart
