E-Mini S&P 500 Futures
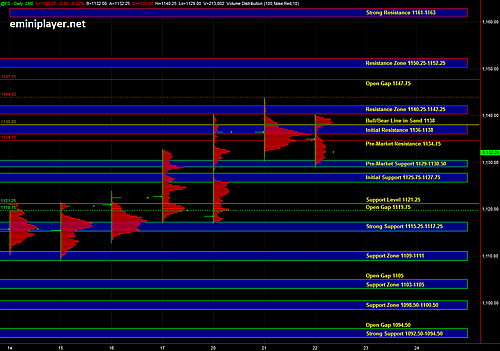
We had 1140.25-1142.25 as Strong Overnight Resistance, which shut off the Buying and provided ideal trade location on the Short side. The O/N Volume Profile is indicative of Long Liquidation. The Bull/Bear Line in Sand is at 1138, and with ES trading in the 1132.50 Area, the immediate bias going into the day session is Bearish. 1126 is a potential target on a break below 1129 O/N Low. Below 1125.75, we have the open gap at 1119.75 as a potential target. I anticipate the Selling to shut off in the 1115.25-1117.25 Support Zone. On the upside, a move above 1138 would be a red flag for Sellers. We'll likely still see rotation in the 1140.25-1142.25 Resistance Zone, but Buyers could be back in Control above 1138, so we need to be cautious on the Short side. A move above 1142.25 would confirm Buyers in Control and the potential target would be the gap fill at 1147.75. I don't see any catalyst for an upside breakout, and my expectation for today is for price to either consolidate or test the lower Support Zones.
Econ Data
MBA Purchase Applications at 6:00 AM (CT), FHFA House Price Index at 9:00 AM (CT), and EIA Petroleum Status Report at 9:30 AM (CT).
ES - Daily Chart with Volume Profile and Key Levels (click on image below to enlarge)
