E-Mini S&P 500 Futures
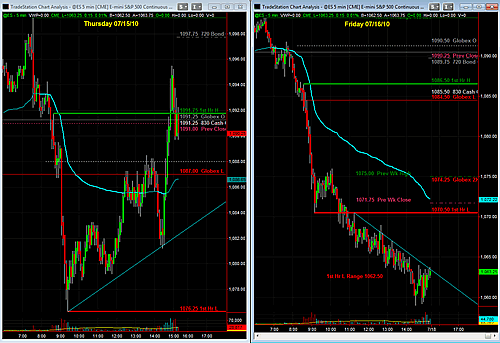
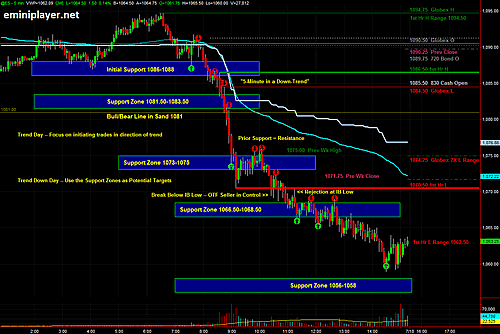
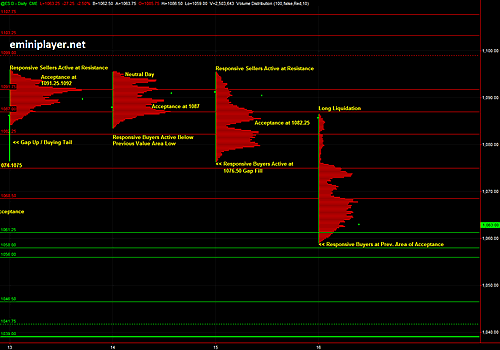
We observed Long Liquidation on Friday. The Trade Plan said "the Bull/Bear Line in Sand is at 1081, and a break below that could lead to initiative selling" -- and failure of the 1081.50-1083.50 Support Zone lead to initiative selling down to 1070.50. Friday was clearly a trend down day, and on trend days, the focus should be on initiating trades in direction of the trend and using the Key Levels as potential targets. One of the members emailed me asking about the difference between Thursday and Friday. The following image shows the 5-Minute Charts from Thursday and Friday side-by-side:
ES 5-Min Thursday & Friday Side-by-Side

Lets go over some basic structural differences between Thursday and Friday:
1. On Thursday, once the IB Low was put in at 1076.25, we got two waves to the upside and price didn't return to the IB Low. On Friday, price broke below the IB Low in the morning and was unable to return back above the IB Low, indicating the Other Time-Frame Seller was in control.
2. On Thursday, price retraced to the VWAP (blue line on chart). On Friday, price did not return to the VWAP. This is typical of Trend Days -- price does not return to the VWAP.
3. On Thursday, once the IB Low was put in, we began seeing improvement in the market internals/breadth whereas on Friday, the internals were weak throughout the day.
4. On Thursday, the VPOC shifted Up. This behavior was not observed on Friday.
I also didn't see down-side exhaustion on Friday, which is why I was expecting ES to make new lows in the afternoon. If you were looking to buy dips on Friday, or looking for a short-squeeze similar to Thursday, I hope the charts and comments above help clarify why the probabilities were not favoring the short-squeeze scenario on Friday.
Notes for Overnight Session
The Key Levels from Friday are in-play in the overnight session -- Prior Support = New Resistance. The 1074-1076 Area is Strong Resistance, followed by 1082.75. On the down-side, 1056-1058 is primary support. A break below that could take us to the low 1040s, which is Strong Support and I am a Responsive Buyer there.
ES 5-Minute Chart

ES Day Session Volume Profile Chart
